|
 |
| Administration | |
|
|||||||||
|
Clickbank Promo Tools 2d
Magnetostatic Analysis of the Permanent Magnet Unbalanced Flux Gate Design © Terrence Staton terrences@speakeasy.net Sunday, June 13, 2004 Introduction I have
been working on a new gate design that I call the unbalanced flux gate. The design incorporates ideas from the
minatowheel Yahoo group. I have been
running many magnetostatic FEA magnetostatic parametric simulations to explore
these ideas. I feel it might still be
too soon to post this idea as I dont want to lead anyone down a path that will
prove to be fruitless. On the other
hand I might be missing something very critical in this research if I dont
share it with others. In the interest
of speeding the progress of this research this document will detail the
research I have done thus far on this gate design. You may not distribute this document or
information contained in this document without prior permission from me. Background I
will present a quick overview of the concepts that are employed in this gate
design. Permanent magnet gate designs are best
constructed using configurations where the magnets are primarily repelling each
other. Using attractive forces is
very problematic due to energy required to pull attracted objects apart. For attractive configurations the
equilibrium state is to remain as close as possible to the object of
attraction. For repelling
configurations the equilibrium state is to remain as far from the repelling
object. Another force such as friction
eventually counter balances the repelling force and then the magnets will
remain at rest. Materials with a relative permeability greater
than 1, ex. steel and iron, can reduce the measured B of a permanent magnet
when placed between the point of measurement and a permanent magnet. The B takes the path of least resistance by
traveling through the steel versus the air. Materials with high relative permeability can
also cause two permanent magnets that would normally repel each other move
toward each other when placed in between the repelling magnets. Materials with high relative permeability often
have non-linear B-H curves. Due to
their non-linear nature they reach a point where they become saturated with
magnetic fields (B). The concept of
saturation refers to the fact that that little to no new magnetic domains can
be created in the material. These
are the most crucial ideas employed for the design tested in this document, but
there are many other concepts which I will not mention here that make permanent
magnet gate designs possible. Simulation and Analysis Procedure All
of the simulations in this document are conducted using 2d magnetostatic
analysis. The permanent magnets are
simulated with Grade 40 NdFeB material.
Parametric analysis is done by moving the rotor through the gate by
creating 16 solutions per inch of movment.
The results of the parametric solving are then exported for analysis
using Matlab. In Matlab area plots as
well as 2d comparison plots are created to analyze the difference of varied
parameters from each gate design. The
trapezoidal integral is also calculated for each area plot to produce the total
area under the entire force curve. Initial Goals of the Project My
initial goal was to increase my understanding of how relative permeability
materials greater that 1 interacted with magnetic flux from permanent
magnets. Several people in the
minatowheel group including myself felt using a material like steel with magnets
configured to repel might prove to be useful in a permanent magnet motor
design. The problem is how to use it
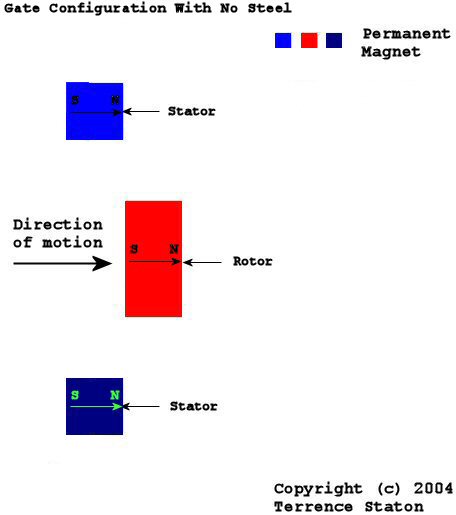
and in what configuration should the magnets be configured. My first step was to tackle the permanent
magnet configuration without using steel.
I needed a configuration where a permanent rotor magnet could pass
through two or more permanent stator magnets producing a repelling force on
both sides of the stators. The
simplest configuration that meets this requirement is to three magnets angle
the direction of its poles such that they are parallel to desired direction of
movement. This configuration is shown
below in Figure 1 Balanced Repelling Gate Configuration.
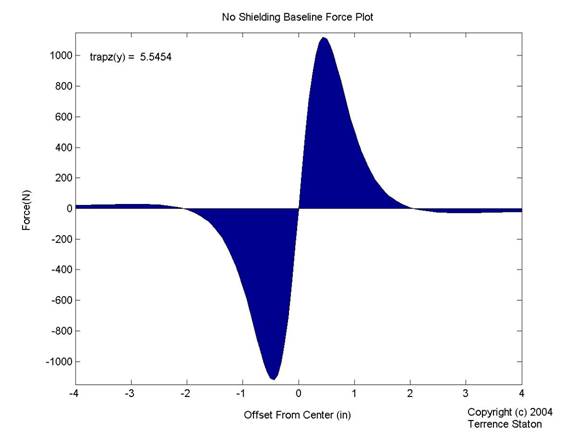
Figure 1 Balanced Repelling Gate Configuration The
force area plot of this configuration is show below in Figure 2 Force Area Plot
of Repelling Gate. This area plot
shows the force exerted on the rotor in direction of motion. A negative force indicates a force in
opposition of the desired direction of motion. A positive force indicates a force in the
desired direction of motion. For the
area plot you can see that the negative forces and positive forces completely
balance each other out. The trapezoidal
integral on this force curve has a result of 5.5454. This is within the margin of error for the
simulation. In a perfect simulation
with no error and infinite number of samples one should expect a result of 0
for the trapezoidal integral.
Figure 2 Force Area Plot of Repelling Gate Now
with a base configuration of magnets selected then next step was figuring out
how to use steel to significantly reduce the negative force without having a
major impact on the positive force. At
first I didnt think I would discover any interesting results. But I eventually created the configuration
shown in Figure 3 Gate7 Configuration.
This configuration had interesting simulation results. The force area plot for this configuration
is shown in Figure 4 Force Area Plot of Gate7.
Figure 3 Gate7 Configuration
Figure 4 Force Area Plot of Gate7 Looking
at the force plot you can see the desired effect of reducing the negative force
with minimal effect to the positive force is present. The trapezoidal integral tells us the area
above the zero axis is significantly larger than the area below. This equates to approximately 22% more
force exerted in the positive direction than the negative direction. In-depth Analysis of the Unbalanced Flux Gate My
thinking behind the design of gate 7 was to see what effect the steel would
have if I used the steel as shield on the side of the stators where I wanted to
reduce the magnetic flux. From
earlier simulations I had learned to not use too much steel. Also the steel that was used for shielding
had to be placed up against the stators.
My idea was to have the magnetic field from the stators saturate the
steel. This would prevent any magnetic
domains from being created in the steel that would have the steel and the rotor
attract. I
began analyzing magnetic flux line plots of Gate 7 at both the positive and
negative peaks. Analysis of the flux
line plots lead me to a new hypothesis to which I proceeded to test. My hypothesis is that it is incorrect to
think of a material with a relative permeability greater than 1 as a magnetic
shield. Instead it is much more
appropriate to think of them as conductors of magnetic flux. Magnetic flux will take the path of least
resistance. When given the choice of
traveling through air or steel, the magnetic flux will travel through the steel
in increasingly higher flux densities until either no more magnetic domains can
be created in the steel or the steel has already created enough domains to
completely carry the magnetic flux to which it is exposed. This is precisely what the B-H curves of
materials show us. The
results of testing this hypothesis lead to the creation of gate10. Gate 10 is shown in Figure 5 Gate10
Configurationand its force area plot is shown in Figure 6 Force Area Plot of
Gate10.
Figure 5 Gate10 Configuration
Figure 6 Force Area Plot of Gate10 The
result of the gate 10 simulation gives evidence to support my hypothesis. Looking at the flux line plots of both the
negative and positive force peaks I observed the following effect. The shape and position of the steel in
gate10 is causing a significant part of the magnet flux moving the rotor in the
x direction to pass through the steel.
In this case part of the N to S flux for the stator magnets is going
through the steel. None of the N to S
flux of the rotor, N rotor to S stator or N stator to S rotor flux is passing
through the steel. By doing this the
negative x inducing interaction of the N to S flux of the rotor and the N rotor
to S stator flux with the N to S flux of the stator magnets is reduced. The size of the steel is just so that it
becomes saturated with the magnetic flux from the stator magnets only. If the steel conducted any of the N to S
flux of the rotor or the N rotor to S stator flux then the desired effect would
be lessened or become an attractive force for the rotor. Next
I wanted to test the result of moving the stators closer together so the rotor
would have a small gap when passing between the stators. The resulting force area plot is show in
Figure 7 Force Area Plot of Gate11.
The trapezoid integral showed a marked decrease over gate10. I concluded that since I am trying to
unbalance the repelling forces on one side of the stators versus the others
then it makes little sense in reducing the size of the gap. A smaller gap is actually much more harmful
due to several reasons as follows: The closer the rotor gets to the steel the more
difficult it becomes to fine tune the shape such that saturation comes only the
stator magnets. Effects from Lenzs Law will increase with a
smaller gap. Reducing the gap increases the repelling force
on both sides of the stators by equal amounts.
Figure 7 Force Area Plot of Gate11 I
managed to improve the gate10 design even more my placing a small amount of
steel on the right side of the stators.
I found that using the steel to lessen the resistance of S Rotor to N
Stator flux showed a larger increase on the positive force versus the increase
on the negative force. The force area
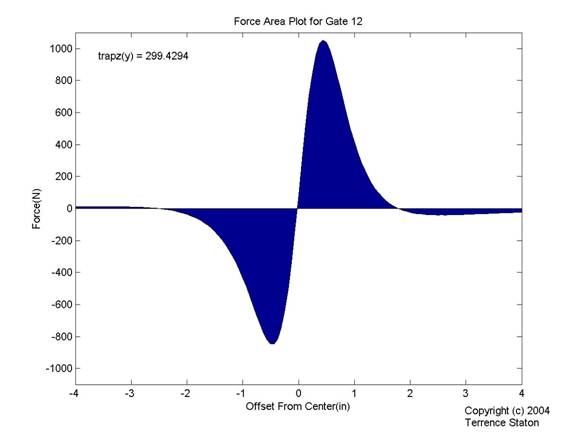
plot of Gate11 is shown in Figure 8 Force Area Plot of Gate. I
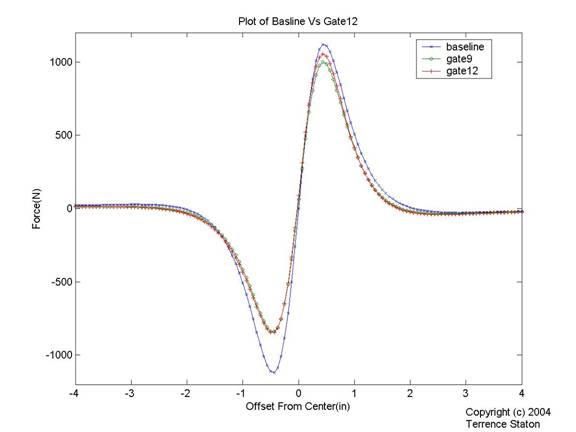
Figure 8 Force Area Plot of Gate12 To
sum up how much of a difference the steel has made in the result of the
magnetostatic simulations take a look at Figure 9 Force Plot of Baseline Versus
Gate . This plot shows the progress
the gates have made over the concepts I have investigated thus far. The shape of the steel could probably be
further refined to improve the desired effect even more. However, I think this work is best left
until the gate design can be explored in 3d magnetostatic FEA.
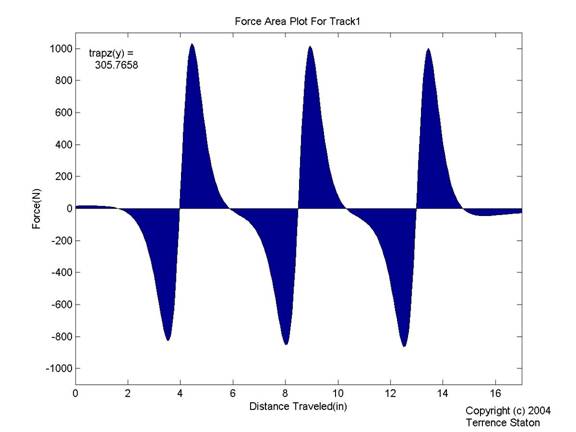
Figure 9 Force Plot of Baseline Versus Gate Configurations Analysis of Unbalanced Flux in a Linear Track Next
I proceeded to do an analysis of the rotor passing through a series of stators
in the gate10 configuration. This
configuration is shown in Figure 10 Unbalanced Flux Track Configuration. The spacing of the stator pairs for this
configuration was chosen to have minimal interaction of the repelling peaks of
the stator pairs. The simulation
results of this configuration are shown in Figure 11 Force Area Plot of the
Track1 Configuration. The graph shows
a very slight negative affect of the stator pairs on upon each other. Each successive positive peak is slightly
lessened while each negative peak grows slightly. The trapezoidal integral clearly shows a
sum total positive x force.
Figure 10 Unbalanced Flux Track Configuration
Figure 11 Force Area Plot of the Track1 Configuration I next
tested the effect of moving the stator pairs close together. The resulting force plot is shown in Figure
12 Force Area Plot of the Track2 Configuration. Here the negative influence of the stator
pairs is much more noticeable. The
trapezoidal integral decreased by 48.5%. Further
testing of the linear track should be done.
A longer track with more stator pairs should be simulated. At the current time I do not feel this is a
very high priority as the linear track serves no practical purpose other than
setting a basis for study multiple stator gate interactions.
Figure 12 Force Area Plot of the Track2 Configuration Conclusion In
summary I would say the gate configuration presented in this document shows
much potential. Unbalancing of
repelling flux forces in the manner described here might possibly be used to
build a permanent magnet motor that has no electrical input. If we use LaFonte balancing with paired
armatures, 4 permanent rotor magnets, in an X layout the motor should self
start without the need for any electromagnets in the motor. My primary concern is computer simulation
versus real world results. My secondary
concern is the need for eddy current analysis to get a better idea of Lenzs
Law effects. Beyond that the amount of
torque that can be produced from this in a possible motor is questionable. My next step is to move to 3d modeling and
magnetostatic FEA simulation. I will
write a follow up document after I have completed my 3d analysis of the
concepts presented in this document.
If the 3d computer simulation results look promising I will have a
physical prototype constructed for testing. Please
e-mail me any feedback, questions or ideas you might have. Better yet post on the minatowheel Yahoo
group and share your thoughts with all of us there. Best of luck to each and every one of us out
there on the quest for free energy! Update of My
Recent Testing Efforts © Terrence Staton terrences@speakeasy.net Thursday June 24, 2004 Here
is an update on the tests I have been doing so far. Generally while I am running computer
simulations I am also conducting some experiments that I setup up with
Legos. I find Legos to be sturdy and
fairly precise. I can get accurate
results even with small forces. I can
often conduct a great many number of experiments in a single night by using
them. Here are some of the tests I
have conducted over the past few days.
Above
is a picture of the Lego train track I often use to conduct linear
experiments. I put rotor magnets on
cars of varying sizes depending on the test.
Then I place stator magnets along the track. This is the setup I use when I test
shielding materials. Both stator magnets
are repelling the rotor magnet in this picture. I put the shielding around one stator magnet
and see how far the car moves towards that magnet. I found that if I didnt conduct this
test before doing other tests with the shielding material I could be wasting my
time as the shielding is ineffective. Right
now I dont have any shielding effective enough to conduct further shielding
experiments. Either they dont absorb
enough B or the shape just is not right.
Since there is only so much I can do with a Dremel, I am trying to
locate a local independently run machine shop so I can get a few pieces of
shielding made that should work very well.
The shape, size and material of the shielding will be based up some of
the simulation results I have conducted thus far. I will use a CAD drawing of the parts to
make sure they are accurately fabricated. Over
the past few days I have been exploring possible motor configurations. Next is a picture with one of my motor
ideas.
I
initial thought this configuration would be a good setup for HJ motor idea that
Graham had. I noticed something a bit
odd about this setup. Only the left
side the stators were set up to repel.
On the right side the stators were setup to attract. As can be seen here there is a sticky
spot. It is possible that one of the
magnets is stronger than the other causing this problem. Also it is possible that the magnets
approaching in arc like this creates the sticky spot. My guess is the former. I need to build my own gauss meter to
confirm this possibility. Next
I tested a more typical motor configuration.
In
this configuration the stator magnets in the 7 and 1 oclock positions are
repelling. The stator magnets in the 4
and 10 oclock positions are attracting the rotors. I
noticed the exact same sticky and repel spots in this configuration as the
previous one. The sticky and
repelling spots reversed depending on which rotors were facing different
magnets. This leads me to believe that
the magnets are indeed imbalanced. I
think it is time I go ahead and get a Hal sensor and build my own gauss meter. Well
that is it for now. If anyone else has
ideas on what might be going on in the above tests I would like to hear your
thoughts the matter. Thanks,
-Terrence
|
|
||||||||||||||||||||||||||||||||||